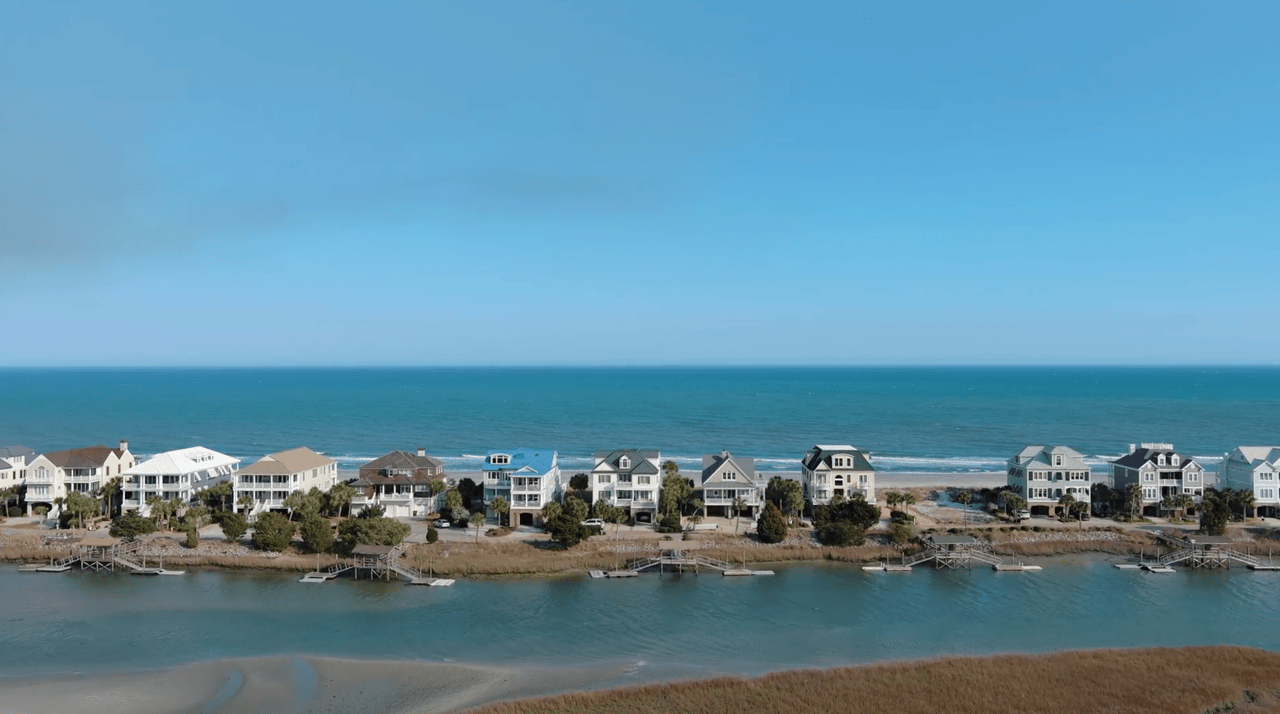
Grand Strand Home Sales Are Flat in 2026. Prices and Pace Aren't.
November 11, 2026
November 11, 2026
Published November 13, 2026. Updated November 13, 2026. Data: CCAR MLS, year to date through November 9, 2026.
Ask around this fall and you'll hear the Grand Strand market slowed down. The count says otherwise. Through November 9, 10,322 single family homes closed across the Grand Strand, three more than the same stretch of 2025. The average sale price rose 2.8% to $446,057, and homes sold four days faster.
Same sales, higher prices, quicker pace. That's the part worth sitting with, because it isn't the story most people are repeating.
The Grand Strand is the roughly 60 mile stretch of South Carolina coast from Little River south to Georgetown, and this data set also takes in Calabash, just over the North Carolina line.
A regional average hides most of what matters if you own or want to own at the upper end of this market. So this report goes past the headline, into price range, how buyers paid, and which towns run on cash. If you want the monthly median and inventory picture, that lives in the November 2026 Myrtle Beach market update.
Growth this year hasn't come from more transactions. It has come from each transaction being worth more.
Single family homes, year to date | 2025 | 2026 | Change |
|---|---|---|---|
Closed sales | 10,319 | 10,322 | Up 3 sales |
Average sale price | $434,049 | $446,057 | Up 2.8% |
Average days on market | 128 | 124 | 4 days faster |
Sold volume (estimate) | About $4.48 billion | About $4.60 billion | Up about $125 million |
Source: CCAR MLS data, year to date through November 9, 2026, compiled by Berkshire Hathaway HomeServices Coastal Real Estate. Sold volume is an estimate, closed sales multiplied by average price.
October ran the same pattern harder. Closings fell to 949 from 1,053 a year earlier, about 10% fewer. The average price rose 5.1% to $454,468, and days on market dropped to 116, the fastest month of the year. Fewer deals, each one worth more.
Fifty nine percent of single family sales this year closed under $400,000, and the busiest range is $300,000 to $399,999. The average sits well above that because the top of the market pulls it up.
Price range | Single family sales | Share |
|---|---|---|
Under $200,000 | 660 | 6% |
$200,000 to $299,999 | 2,552 | 25% |
$300,000 to $399,999 | 2,921 | 28% |
$400,000 to $499,999 | 1,516 | 15% |
$500,000 to $599,999 | 957 | 9% |
$600,000 to $699,999 | 659 | 6% |
$700,000 to $799,999 | 368 | 4% |
$800,000 to $899,999 | 165 | 2% |
$900,000 to $999,999 | 106 | 1% |
$1 million and above | 424 | 4% |
Source: CCAR MLS data, year to date through November 9, 2026. The price range pull totals 10,328, six more than the headline count, a timing difference between two pulls.
Read the bottom three rows together. The count falls as price rises, 165 and then 106, and then it more than doubles to 424 at $1 million and above. Add the condos and townhomes that closed at $1 million or more and the total is 458. The $1 million market here isn't a thin tail. It's larger than the $800,000 to $999,999 range by more than half.
Among single family sales at $200,000 and above, 28% of buyers paid cash and 71% financed. Conventional loans carried most of that.
How buyers paid, $200,000 and above | Sales | Share |
|---|---|---|
Conventional loan | 5,091 | 53% |
Cash | 2,680 | 28% |
FHA loan | 975 | 10% |
VA loan | 711 | 7% |
USDA and other loans | 116 | 1% |
Other | 95 | 1% |
That 28% is an average too. Break it out by price and it nearly doubles from the bottom of the range to the top.
Price range, single family | Share of buyers paying cash |
|---|---|
$200,000 to $299,999 | 23% |
$300,000 to $399,999 | 24% |
$400,000 to $499,999 | 28% |
$500,000 to $599,999 | 32% |
$600,000 to $699,999 | 34% |
$700,000 to $799,999 | 33% |
$800,000 to $899,999 | 39% |
$900,000 to $999,999 | 46% |
$1 million and above | 45% |
Source: CCAR MLS data, single family sales at $200,000 and above, year to date through November 9, 2026.
Cash also closed faster. The median cash sale spent 93 days on the market, against 107 for financed sales. And the cash share has been rising. It ran between 25% and 30% from January through September, then reached 34% in October, the highest month of the year.
Where a home sits changes who shows up with a loan and who shows up with a wire. The towns on the water lead the cash list. The inland towns sit at the bottom of it.
Town | Share of buyers paying cash |
|---|---|
Surfside Beach | 42% |
Pawleys Island | 41% |
Calabash | 40% |
Murrells Inlet | 37% |
North Myrtle Beach | 35% |
Little River | 33% |
Myrtle Beach | 31% |
Georgetown | 30% |
Longs | 23% |
Aynor | 21% |
Conway | 19% |
Loris | 17% |
Source: CCAR MLS data, single family sales at $200,000 and above, year to date through November 9, 2026.
In Surfside Beach and Pawleys Island, roughly four in ten buyers paid cash. In Conway and Loris, about eight in ten financed. A seller in one of those places is preparing for a different kind of offer than a seller in the other.
Lumped together, condos and townhomes look steady: 4,443 sales, up 3.1%, at an average of $268,298, down 1.7%, with a median of $234,899. Split them and two different years appear.
Year to date | Condos | Townhomes |
|---|---|---|
Closed sales | 3,430, down 2% | 1,013, up 26% |
Average sale price | $258,106, down 3.5% | $302,809, up 2.2% |
Share of buyers paying cash | 57% | 32% |
Sale price as a share of asking | 96% | 98% |
Cash runs the condo side at both ends of the price list.
Price range, condos and townhomes | Sales | Share | Paying cash |
|---|---|---|---|
Under $100,000 | 303 | 7% | 86% |
$100,000 to $199,999 | 1,311 | 30% | 55% |
$200,000 to $299,999 | 1,500 | 34% | 43% |
$300,000 to $399,999 | 696 | 16% | 47% |
$400,000 to $499,999 | 310 | 7% | 47% |
$500,000 to $749,999 | 241 | 5% | 57% |
$750,000 to $999,999 | 48 | 1% | 67% |
$1 million and above | 34 | 1% | 74% |
Source: CCAR MLS data, year to date through November 9, 2026.
Overall, 52% of condo and townhome buyers paid cash, and FHA and VA loans together made up only about 4% of those sales. Sales under $100,000 are up 65% from last year, which is a large part of why the average price slipped. A lower average here says more about which units sold than about what any one unit is worth.
Freddie Mac's survey put the average 30 year fixed mortgage rate at 7.18% on November 5, 2026, the third weekly decline in a row, against 6.22% a year earlier. The Federal Reserve raised its benchmark rate in September and held it at its October 28 meeting.
Nationally, the National Association of REALTORS reported existing home sales down 2.2% from a year earlier in September, with the median price up 1.3%. Those are monthly national figures set beside a local year to date average, so treat the comparison as context and not a scorecard. Still, a market with flat sales and a 2.8% higher average in a year when borrowing got more expensive is holding its ground. The rising cash share is one plausible reason, and it's the number to watch.
This is arithmetic, not a forecast.
Fourth quarter | Single family | Condos and townhomes |
|---|---|---|
Closed sales, fourth quarter 2025 | 3,016 | 1,277 |
Closed sales, October 2026 | 949 | 423 |
Needed in November and December to match | 2,067 | 854 |
If you're selling above $800,000. Close to half of the buyers in your range paid cash this year. That shapes what a strong offer looks like and how you'll want funds verified. It doesn't change the first job, which is pricing against the homes a buyer can walk into this week, not only the ones that closed last spring. A property specific valuation is the place to start.
If you're buying near the water. Expect to compete with cash in the beach towns, and expect that cash to move faster. A financed offer can still win. It needs to arrive fully underwritten and clean. If the purchase is a second home, read up on how South Carolina taxes second homes before you set a budget.
If you own a condo. Your buyer is more likely than not paying cash, and will be reading the association's dues, reserves, insurance coverage, and assessment history as closely as the listing. Have those documents ready before the first showing.
If you're still deciding where. Start with what's on the market now in the towns above, and compare by price range, not by county average.
No. Single family closings are flat, 10,322 through November 9, 2026 against 10,319 in the same period of 2025. October alone was down about 10% from October 2025.
The average single family sale price is $446,057 year to date, up 2.8%. Most sales are lower than that. Fifty nine percent closed under $400,000.
424 single family homes and 34 condos or townhomes, 458 in total, through November 9, 2026.
About 28% of single family buyers at $200,000 and above, rising to about 45% at $1 million and above. For condos and townhomes it is 52% overall.
Surfside Beach at 42%, Pawleys Island at 41%, and Calabash at 40%, among single family sales at $200,000 and above. Loris is lowest at 17%.
The average condo sale price is down 3.5% to $258,106 this year, while townhomes are up 2.2% to $302,809. Much of the condo decline reflects more sales under $100,000, so the average does not describe any single building.
Local figures are CCAR MLS data for the Grand Strand market area, year to date through November 9, 2026, compiled by Berkshire Hathaway HomeServices Coastal Real Estate. Cash and financing figures cover single family sales at $200,000 and above unless noted. Sold volume is an estimate. Mortgage rates are from Freddie Mac's Primary Mortgage Market Survey, November 5, 2026. National sales and price figures are from the National Association of REALTORS existing home sales report for September 2026. Monthly regional statistics are published by the Coastal Carolinas Association of REALTORS. This report is informational and is not financial, legal, or tax advice. Past sales do not predict future prices.
About the author. Megan Parker is a second generation Myrtle Beach Realtor with Berkshire Hathaway HomeServices Coastal Real Estate, working with buyers and sellers of luxury and waterfront property from North Myrtle Beach through Pawleys Island and Georgetown.
Megan Parker reads this market one price range and one town at a time, because that is how her clients have to buy and sell in it. If you want these numbers cut for your street, your building, or your price point, Let's Connect.
From Megan's Desk
Through November 9, 10,322 single family homes sold, three more than last year, at an average price up 2.8% and four days faster.
Single-family homes are holding their ground while condos face a different set of challenges. What November's market data means for buyers and sellers along the Grand … Read more
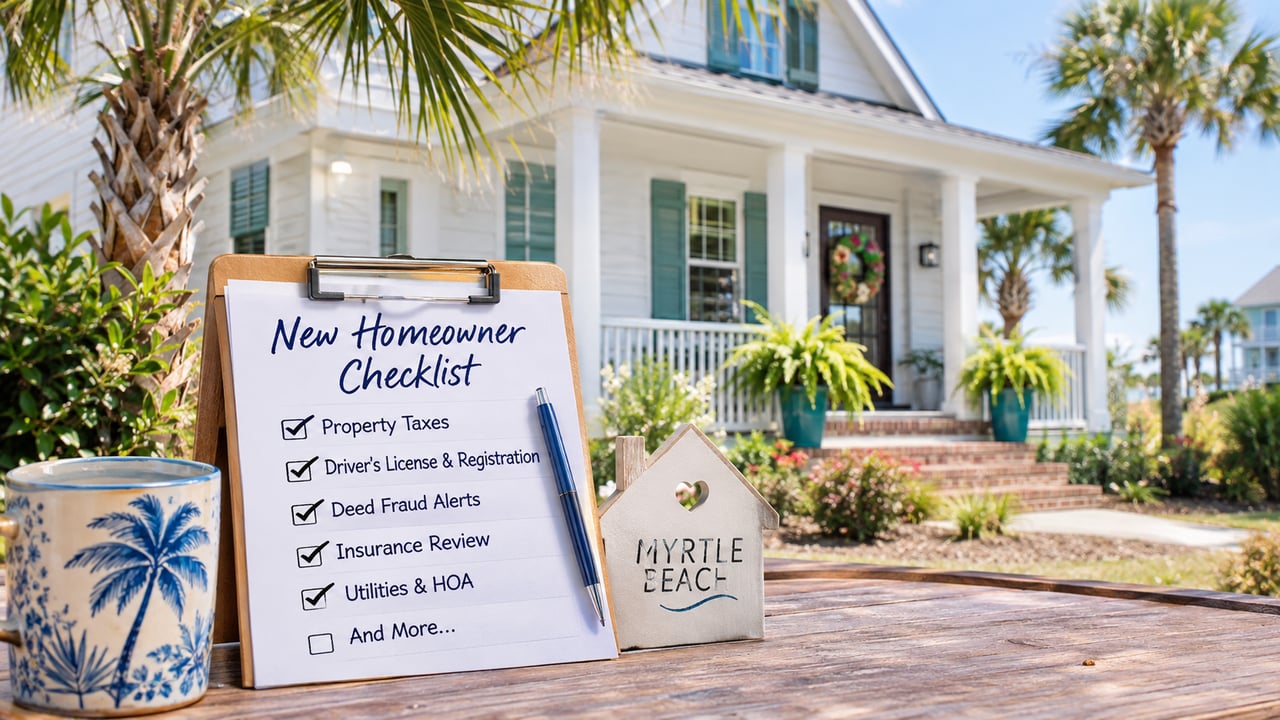
From property tax savings to paperwork most buyers overlook, here's what to take care of after getting the keys to your coastal home.
How South Carolina's 25% ATI exemption could lower property taxes on qualifying second homes and investment properties along the Grand Strand.
A new sales tax begins May 2027, with property tax credits planned for homeowners, second-home owners, and other property taxpayers across Georgetown County.
Myrtle Beach Real Estate Tips
How to protect your coastal property with free deed monitoring alerts in Horry and Georgetown Counties before a costly surprise catches you off guard.
How one simple application could save Myrtle Beach homeowners thousands in property taxes each year.
From buying and selling to real estate investing, Megan Parker delivers trusted guidance, local market expertise, and personalized solutions tailored to your goals. Her client-focused approach ensures a smooth, successful experience at every stage of your real estate journey.